A recent blog post proclaims “Big Data is Dead.” Not coincidentally, this proclamation is made by the folks supporting DuckDB, a database system optimized for local in-process deployments. (P.S. I am a fan of DuckDB and I’m planning to swap out PostgreSQL with DuckDB in my data engineering class the next time I offer it. And Ponder lets you run your data science workflows on DuckDB!)
All that said, I’m here to declare “not so fast!” I draw on lessons from the database research community to argue that any organization has big data, medium data, and small data needs. Rather than shaming people for the size of their data or data needs, we as data infra tool builders should optimize for how to help people get the insights they need from their data — be it in the form of a report, a visualization, or an ML model — independent of size, using the modality they are most comfortable with. We should learn to embrace — and admit the legitimate existence of — all sizes of data!
Who am I and why do I care?
I’m a cofounder at Ponder and an associate professor at UC Berkeley. I’ve been part of the database research community for over a decade at this point. I was there when “Big Data” became the hot new buzz word — despite the database community holding the VLDB (Very Large Data Bases) conference since the mid-1970s. I entered the community (in 2008) around the time Stonebraker and DeWitt declared that MapReduce was a giant step backwards. I was around (in 2010) when MongoDB claimed to be “web scale.” And I was around (in 2012) when Spark first entered the scene.
Try Ponder Today
Start running pandas and NumPy in your database within minutes!
And over the past decade, I’ve worked on systems to support small, to medium, to big data analysis contexts, including spreadsheets and visualization systems, and most recently, pandas — a system that is often used in small-to-medium contexts.
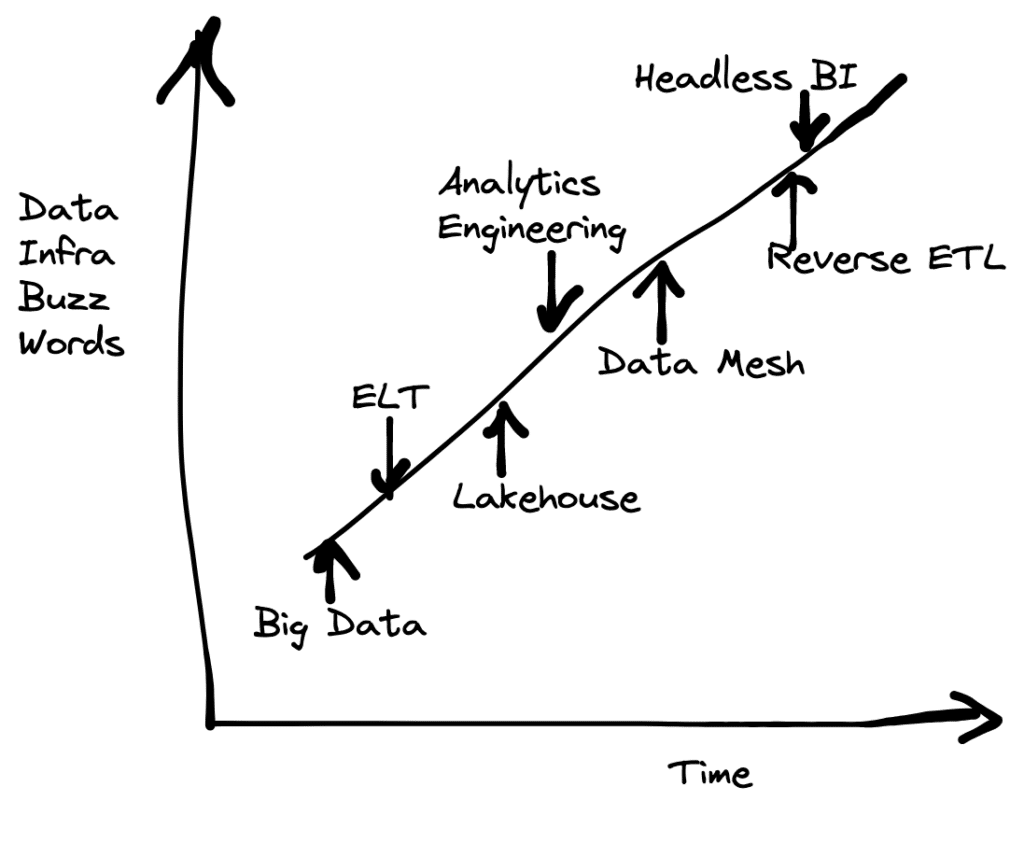
I care mostly because I think the data infra community has enough buzz words already! Where there is a void, a new buzz word will emerge in its place. And I’ve grown to like “Big Data” after a decade, after having reluctantly accepted it. So this is a desperate plea to everyone to please oh please not kill “Big Data.”
About this post
Below, I will analyze each claim made by the original post, provide a rating and a response. This is very much a tongue-in-cheek post written in the style of fact-checking reporting. I don’t take myself too seriously, so I hope you won’t either!
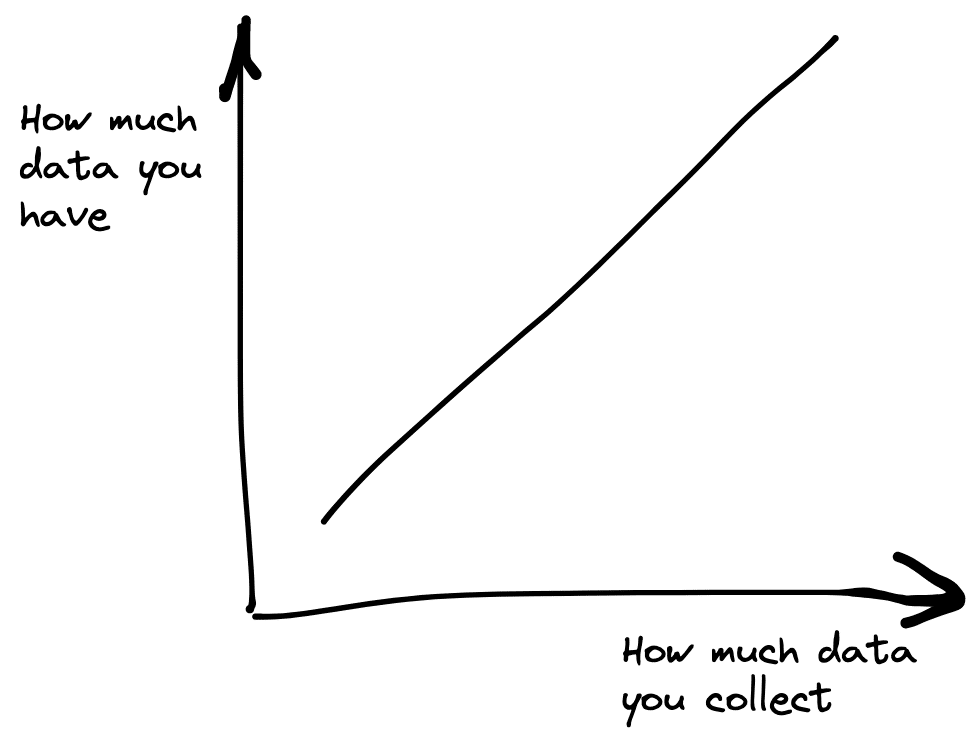
The original post uses several hand-drawn visualizations to make their point, so I will do so too. Indeed, as the graph below shows, the more the hand-drawn graphs an article has, the more readers trust the article.
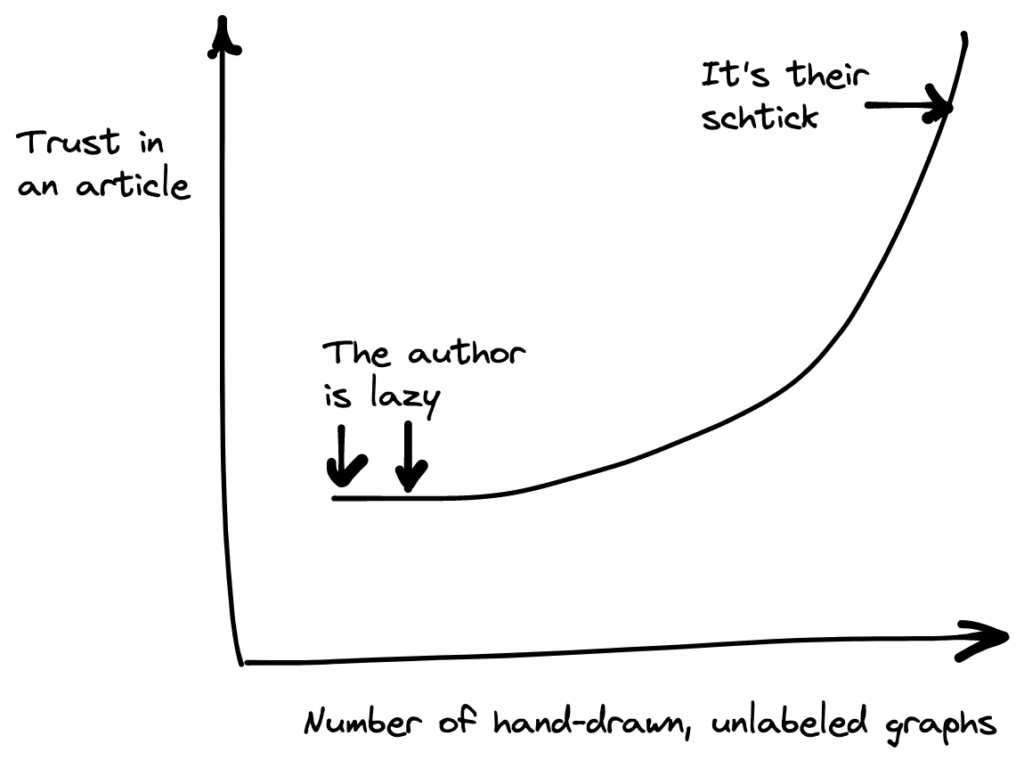
Let’s begin!
Claim 1: NoSQL systems for OLAP are stagnating relative to traditional data management systems
Rating: Partially True
Truism: Pure NoSQL systems for OLAP are stagnating relative to traditional data management systems because traditional systems slowly expanded support for NoSQL capabilities
NoSQL systems were all the rage in the early 2010s. In the OLAP space, these systems promised two key features: the lack of upfront schema specification, and new non-SQL-based query APIs. We saw a wide swath of such systems emerge, many of them building on the Map Reduce paradigm and extending it by adding more declarative querying functionality, including Pig, Hive, Dryad, MongoDB (which also targeted OLTP workloads simultaneously), and the original Spark framework. We also saw the emergence of Snowflake in 2012 and Dremel from Google in 2010, both of which decided to take a different approach of embracing SQL, while continuing to not require upfront schema specification.
Fast-forward to 2022, and what do we see? In brief, the systems that either started by adopting SQL or migrated to supporting SQL — while not requiring upfront schema specification — stood the test of time. Snowflake and BigQuery (Dremel’s commercial avatar) continue to be incredibly popular as is Spark (and Databricks), when they migrated to supporting SparkSQL. In parallel, traditional relational databases like PostgreSQL expanded their support for schema-free data formats with JSON in 2012, and MySQL did the same in 2015.
So what are the lessons here? The main lesson is that you should bet against popular data query languages, such as SQL, at your own peril! A recent Stack Overflow Developer Survey estimates the fraction of programmers who use SQL or plan to use it in the coming year at about 49%. With such enduring popularity, it is hard for another general purpose data querying language to catch on.
Fun fact: Pandas’ popularity — for data science and ML use cases — is also high — at 25% of all programmers, and pandas has been around for 15 years at this point. Even with all of the Spark and Hadoop rage, the number of programmers who know either framework is less than 5% each — which explains why Spark moved on to support SQL via SparkSQL.
Another lesson is that being tolerant and flexible to user workloads and requirements is always helpful, even as you support them with the languages they prefer to employ.
Claim 2: Most people don’t have that much data
Rating: Misleading
Truism: People don’t have much data if they don’t collect any.
The original post claims that most organizations don’t have that much data. Indeed, as the original post argues, if you are a medium-scale business and all you’re storing are the orders made by customers or marketing leads, it is hard to imagine how your data is going to scale to terabytes or petabytes.
It’s useful to distinguish what I call “record-keeping data” of the aforementioned types (e.g., customer names, phone numbers, and email addresses) from “operational data” (i.e., data generated from processes, interactions, events, or transactions), which tends to grow much quicker and is equally ubiquitous. Consider the same medium-scale business operating a website or a mobile app. In such a setting, if you are tracking user interactions (clicks, scrolls, hovers, ..) with this website or mobile app, it is easy to see how even one session can generate a lot of data. And this isn’t restricted to “long” tables — for example, Google Analytics tracks hundreds of visitor attributes, leading to also very “wide” tables. In these cases, slicing through the data to see how individual or groups of similar customers are interacting with your site or app — or both — over time, can be tremendously useful both for reporting and insight generation purposes, but also for ML/AI.
Beyond Internet user interaction histories, organizations in most verticals suffer from the never-ending deluge of operational data, usually in the form of activity logs or time series. This includes organizations in healthcare, finance, hardware/networking, retail, gaming, and automotive, among others. A key source of such operational data is IoT or sensors — recent estimates peg data of this form reaching 163 Zettabytes by 2025. This fine-grained data can help build high-resolution, personalized models of the world around us.
Overall, it is hard to imagine an organization that would not have access to this kind of rich, fine-grained operational data, unless they choose to not collect it. In my experience, most organizations do collect this data — but it languishes away in cold storage because the perceived cost of using it is so very high. Irrespective, if an organization does choose to collect it — and most of them do — you very quickly get into “big data” problems.
Claim 3: There is a bias in favor of storage in the separation of storage and compute: as storage grows, compute stays fixed
Rating: Misleading
Truism: Compute needs do not stay fixed over time — the needs vary on a day-to-day workload to workload basis. Flexibility on both data size and compute dimensions is key.
The original post states that storage grows while compute needs stay the same; it argues that organizations typically have a single requirement for storage and compute, and that these grow at different rates.
But any one who has worked in a data team will tell you that boiling the entire organizations’ needs down to a single value for data size and compute is simply unrealistic. In fact, there are a range of data and compute needs on a day-to-day, workload-to-workload basis.
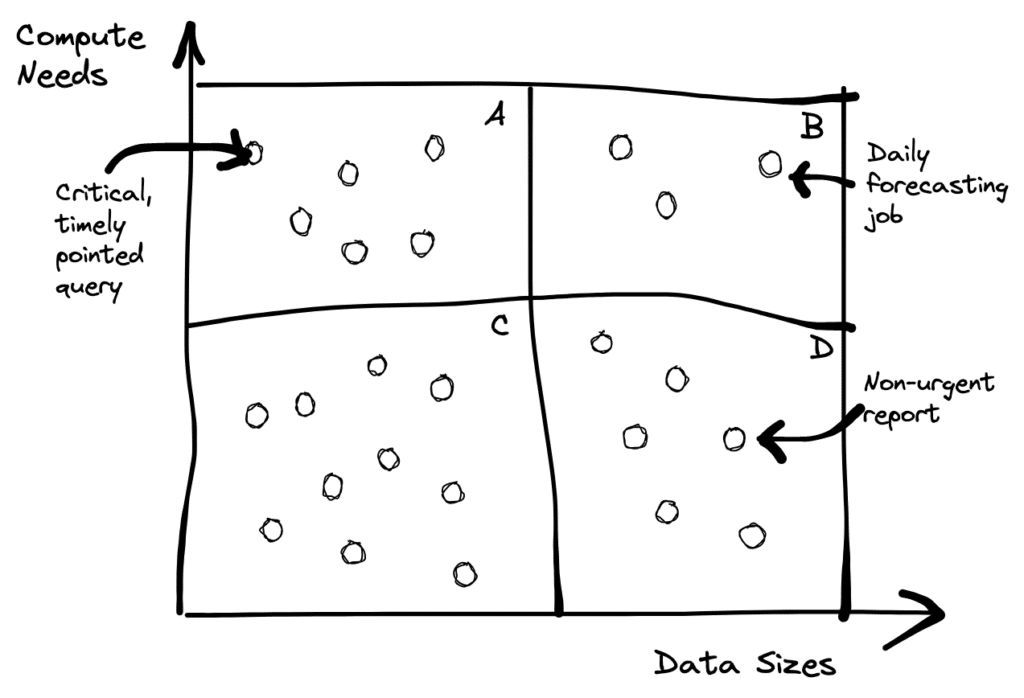
As we can see in the chart above, in region A, we might want to operate on a small data set, but throw more resources at the workload, just because it is a time-sensitive query (e.g., a team rushing to ship a new feature by a given deadline that needs to make a data-driven decision). Or in region B, we might have a job that is both time-sensitive, and operates on most of the data, such as a forecasting job — or an ad click prediction job. Or you could have jobs in regions C or D where the compute needs are not as significant.
The point is that the data and compute needs within a team and across teams vary based on any number of factors. You have regular jobs intermixed with one-off time sensitive needs. It is hard to anticipate what types of needs you will have in advance and provision for it. This is precisely where flexibility in storage and compute is helpful. Distilling it down to one number and claiming that that will stay constant for an organization misses the point.
Claim 4: Most historical data is rarely queried
Rating: Partially True
Truism: While recent data is queried more, plenty of mission-critical needs require querying all of the data
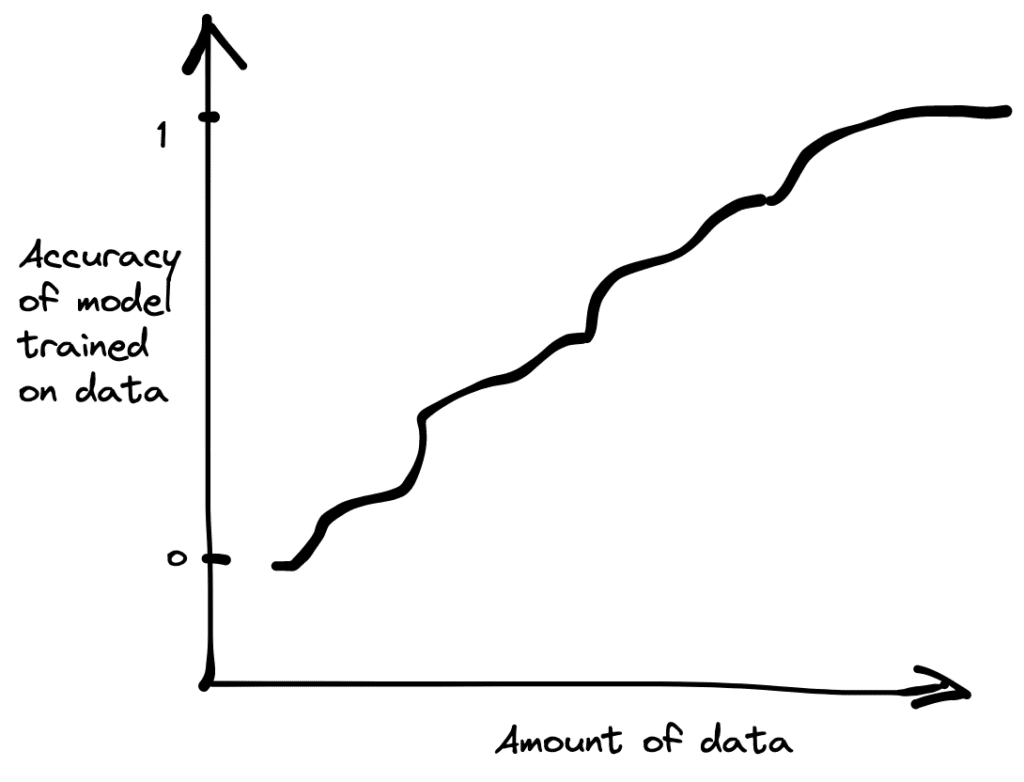
In our conversations with folks doing data science/AI, this much is taken for granted: more data leads to better models. There is one finance fortune-100 company that we work with that really wanted to operate on 60 months of historical data, but were only able to work with 6 months of data — because pandas would break down beyond that point. This company would prefer to work with more data if they could, because it would lead to better financial forecasting models.
As companies become more and more data-driven, and more capable at handling larger datasets, the more they want to query all of the data, not just a small subset. It is also not true that companies only focus on reading the most recent data: often, the company is interested in a slice of data that corresponds to certain conditions (e.g., a specific zip code, or a specific mobile OS version) — and assembling enough data to build confidence in the insight or the model often requires looking all the way back in time.
The original post argues that if you have a petabyte sized table containing data from the past 10 years, you would rarely query beyond the past day. Sure, if all you wanted to know was “how did I do yesterday” then that would suffice, but if you wanted to identify temporal patterns across various data slices over time, looking at more of the data is essential. This is especially true for data science/AI needs where the needs are fairly ad-hoc, iterative, and experimental – this is not a nice-to-have for most organizations, it is essential to be able to “look back in time” when needed. If you are not occasionally exploring data with new, complicated questions — What are you even doing?
Another scenario where it is essential to “look back in time” involves changes upstream that impact downstream models/pipelines. In most large organizations, different pipelines are managed by different teams, and there are many settings where the definition of a dataset generated upstream changes (e.g., a column now has more NULL values because the incorrect sentinel value -1 for the age column has now been replaced with NULL) — without downstream consumers being notified about it. This sort of change is easy for downstream customers to identify if they have the ability to look over historical data — and happens more often than one would think. Overall, if one is to design ML features that are to be meaningful over time, being able to examine large historical datasets over a wide time range is essential.
Claim 5: The big data frontier keeps receding.
Rating: Partially true
Truism: More modern servers can handle “big data” by themselves, but keeping them provisioned throughout can be quite expensive, as opposed to scaling up and down lower-cost machines in a cluster on-demand
The original post claims that if you define big data as what doesn’t fit in a single machine, more and more workloads are no longer big data workloads. This is because you can now provision machines with a lot more RAM and a lot more cores. So the definition of a “machine” has changed: It has started to look more like servers of yore.
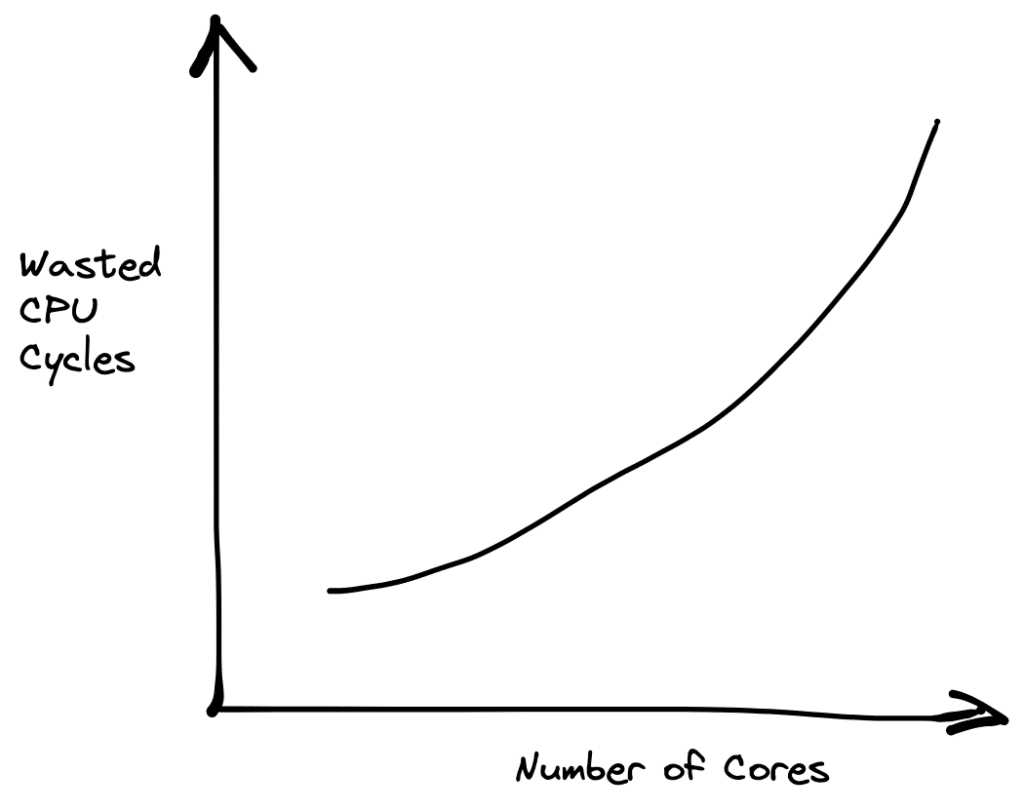
So far, I am in agreement. However, the economic argument fails to hold water: beefy servers are quite expensive: for example, a 24TB memory instance costs $130+/hour on AWS. Even a bathroom break at that point can be really expensive: as the number of cores grow, it is more likely that you are going to be wasting computation at some point. By paying for CPUs, you pay for idle CPU cycles.
A more cost-effective option would be to provision what you need, depending on the workload. If you have a workload that doesn’t require as much memory (e.g., a scan-intensive workload), provisioning more or less machines on demand that can together achieve the same performance rather than simply provisioning the beefiest server instance, would be more sensible. This is, in fact, precisely what cloud data warehouses do.
Claim 6: Data is a liability
Rating: Mostly untrue
Truism: Unless you’re on the run from the law, for most organizations, data is an asset.
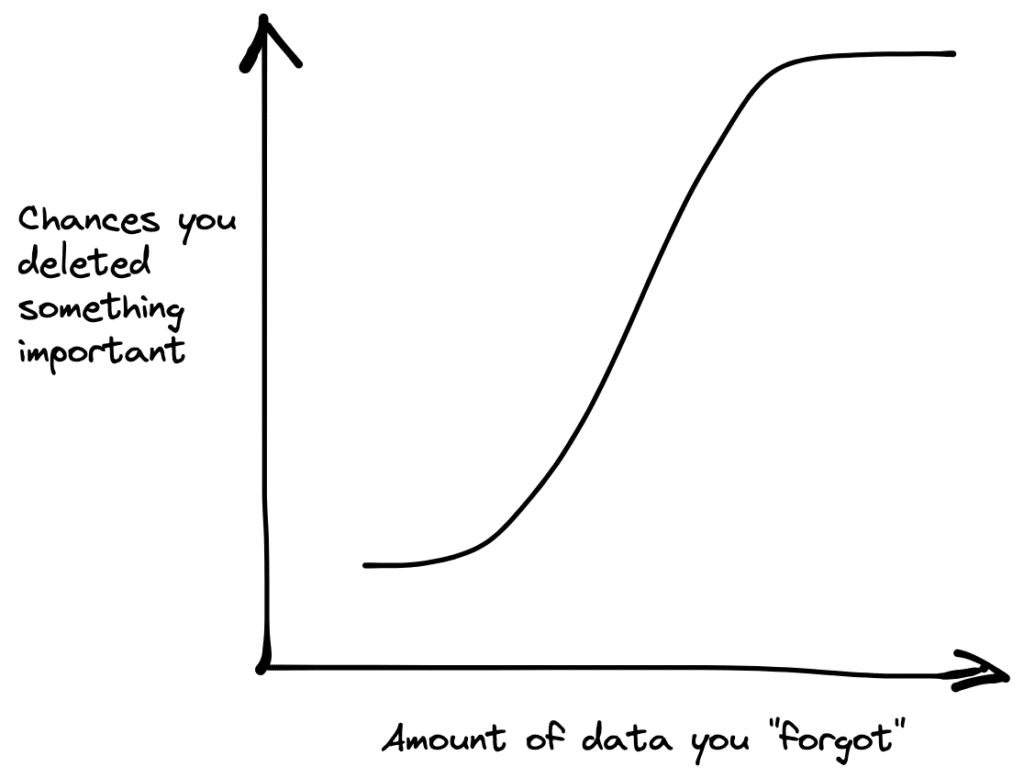
The original post claims that data is a liability — you should delete your old data forthwith! Part of the reasoning is that you could get into legal trouble thanks to your data. As the chart below shows, this is a dangerous move.
For most organizations that we’ve spoken to, they want to do more, not less, with data. Deleting data is the opposite of doing more. Even organizations with severe GDPR concerns, it is usually out of the question to delete their valuable data assets — instead the usual approach is to augment it with additional information (e.g., to capture how a data product is derived) that helps respect rules and regulations.
The original post additionally claims that you could simply store aggregates for the old data, as opposed to storing the raw data — and thereby retain most of the value of the old data. This line of reasoning is faulty. If you are storing aggregates (usually known as measures in OLAP speak), then you would need to do so for various combinations of other attributes (usually known as dimensions in OLAP speak). The challenge, however, is that the number of combinations of dimension attribute values grows exponentially. This is often known as the curse of dimensionality. So this approach is simply infeasible, especially for wide tables that are increasingly the norm.
Another reason why this approach doesn’t work is because things change! In the course of regular business, data definitions, classifications, and metrics changes more often than one would imagine. Being able to define a new metric that groups the data in a different way, or performs a different kind of aggregate — all performed retrospectively, is really important.
Beyond this issue, there are often important peculiarities in your data that would be entirely “aggregated away.” Say you had certain abnormal shopper behavior around Prime day. If you decided to aggregate away last year’s data, you wouldn’t be able to correlate this year’s Prime day behavior with last year’s Prime day behavior, allowing you to explain the anomaly.
A Helpful Analogy: Scuba vs. Snorkel
One way to think about the difference between big data tools and small/medium data tools is the difference between scuba diving and snorkeling.
What scuba and snorkeling have in common is that they are both enjoyable water activities. When you wear scuba gear, you can stay near the surface, or go deep. When you wear a snorkel, you have to stay near the surface. Scuba gear is a complete replacement for a snorkel, and provides functionality beyond it. Some might say scuba gear is cumbersome, but for most people who’ve tried both, scuba diving is a lot more pleasant and rewarding than having to return to the surface frequently! Basically, why just stay on the surface when one can dive in?
Similarly, sometimes one needs to go deep with one’s data, and sometimes one wants a surface-level insight — it’s best to use a tool that lets you do both.
Everybody is in the Big Data One Percent
The original post argues that only the organizations with the top 1% of data needs need to worry about “Big Data.” Hopefully, with my post above, I’ve convinced you that there is no such thing as the Big Data 1%: Most organizations that collect data have needs that range from small to big data sizes, and from small to large compute requirements — on a day-to-day and query-to-query basis. Being flexible to varying organizational needs is paramount.
A better framing is to focus on the tools, not the data. It shouldn’t matter if you are in the 99% or the 1% of data sizes: We should help users get the insights or build the models that they need from the tools they want to use, regardless of data size. Sometimes you want a quick-and-dirty superficial insight, sometimes you want to dive deep into the past: The best tools let you do both without requiring a change in workflow.
At Ponder, we want you to be able to run popular data science libraries like Pandas and NumPy on datasets of all sizes, all from the comfort of your favorite notebook or IDE. We won’t judge you if your data is big 1% of the time, 10% of the time, or 100% of the time. We don’t care where your data resides, be it a cloud data warehouse, or your laptop. Sign up here if you want to try out Ponder.