

TLDR: In this post, we dig into a decade of Stack Overflow Developer Survey results, and learn that: Python’s popularity more than doubled between 2013 and 2022; people love Python now, but no more than before; pandas is now as popular as Python was in 2016; pandas has high adoption in the Python community; people love pandas (mostly); pandas is more popular and more loved than Spark / Hadoop
Here at Ponder, we’re unabashedly pro-Python and pro-pandas, and we love monitoring their success. So when the 2022 Stack Overflow Developer Survey came out, we couldn’t help but do a deep dive on the implications of the results for Python generally and pandas specifically. What we found was a story of immense growth, which qualitatively, wasn’t too surprising — We knew the Python ecosystem was doing well. But we were surprised to see just how explosive this growth has been. Surprised, and delighted.
In what follows, we dig into a decade of Stack Overflow Developer Surveys to demonstrate six major Python/pandas developments, setting the stage with the Python-wide developments first, and then moving into the pandas ones:
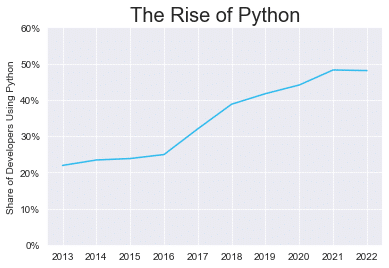
- Python’s Popularity More Than Doubled Between 2013 and 2022: In 2013, 21.9% of developers said they had done extensive development work in Python over the past year, and by 2022, that number had risen to 48.1%.
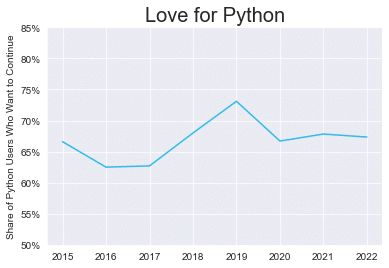
- People Love Python Now, but No More Than Before: ~67% of Python users say they want to continue to using Python in the coming year, putting Python near the top of the list.
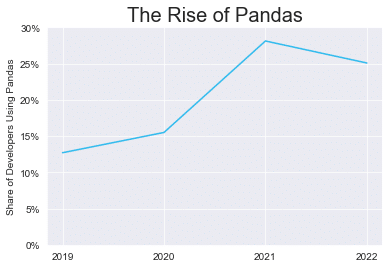
- Pandas Is Now As Popular As Python Was in 2016: Pandas usage has grown so much in the past few years that the share of all developers using pandas in 2022 (25%) matches the share Python had six years ago!
- Pandas Has High Adoption in the Python Community: About half of all Python users are pandas users.
- People Love Pandas (Mostly): 65% of pandas users want to continue using it in the coming year, which is very close to Python’s 2022 levels (67%), but this is down from ~75% in 2019.
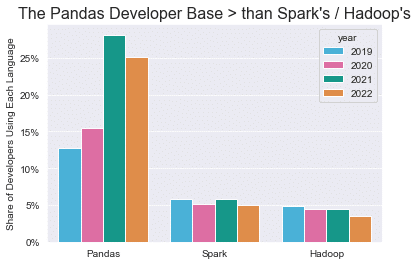
- Pandas is More Popular and More Loved than Spark / Hadoop: The pandas developer community is more than 5X larger than the Spark / Hadoop communities, and pandas is more loved. Not-so-subtle plug: All good reasons to be interested in the scalable pandas solutions we’re cooking up at Ponder!
Background on the Survey + Simplifying Assumptions
Stack Overflow has been administering its survey since 2011, and each year, the sample size has changed, mostly up and to the right: The 2013 survey had 8K respondents, and in 2022 that number was more than 70K! These changes, not to mention the evolution in the composition of respondents (age, gender), can make analyzing this data really hard.
For simplicity, in this post we sidestep these hard questions about the representativeness of the results, both at a point in time, and over time (shifts in the composition of respondents make interpreting the results a real challenge). But we recognize that some of the takeaways could be sensitive to these biases, and we’d love feedback if you think taking them into account materially changes our conclusions!
Python’s Popularity more than Doubled Between 2013 and 2022
In 2013, 21.9% of the developers surveyed said that they had done extensive development work in Python over the past year. By 2022, that number had more than doubled to a whopping 48.1%! This growth is bonkers!
What makes this even crazier is that these numbers understate the absolute growth Python has experienced, because they don’t reflect the fact that the data science / software developer sector as a whole has grown rapidly over the past 10 years — so Python has doubled its popularity in a sector whose popularity is growing!
To put Python’s growth in context, here’s how the 12 languages that Stack Overflow asked about in its 2013 survey have fared over this span:
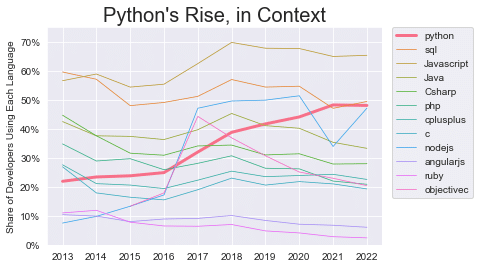
We see that Javascript was very popular in 2013 (57%), and has become even more popular since then (65%); SQL has faded a bit, but remains strong, going from the number one spot (60%) to essentially tied with Python and Node.js at number two (49%), a drop of over 10 percentage points; and there are some obvious losers — C#, Objective-C, Ruby, PHP, Java.
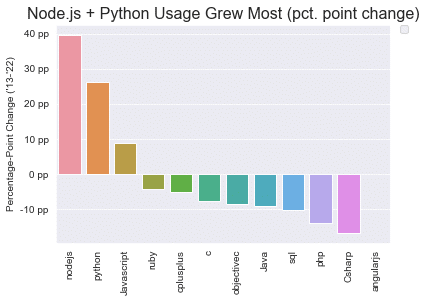
We can better understand these 2013-2022 changes by looking at two different metrics:
- The first is to calculate the change in percentage points, so take the 2022 number and subtract the 2013 number. So for Python, we’re looking at 48% share in 2022 minus a 22% share in 2013, which is a 26 percentage-point change.
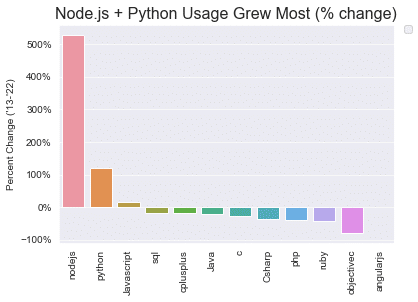
- The second approach is to calculate the percent change: So (new – old)/old. What this does is help you answer the question: “Are these changes big, relative to your baseline?” So for Python, that’s (48.1%-21.9%)/21.9%, or 120%.
Side note: As a data scientist, I’ve seen this “percentage point change” v. “percent change” distinction cause so much confusion. One team will say that a metric went up by 5% when it went from 5% to 10%, but really, that’s a 100% increase! It doubled!
So looking at the percentage-point change in popularity between 2013 and 2022, we see that the biggest winners over this period (of the original 12 languages that Stack Overflow tracked) were Node.JS, Python, and JavaScript. The languages that took the biggest hit were C#, PHP, AND SQL.
Looking at the percent change in popularity between 2013 and 2022, we see that Node.JS and Python were the real winners, with Node.JS the particular standout because it started from such a low base. This metric shows that Objective-C has been especially hard hit — It went from 11% popularity to a little over 2%, a drop of almost 80%! This didn’t show up as strongly on the percentage-point change chart because Objective-C started from a somewhat low base. If you’re at 11% popularity, the biggest possible drop you could experience is an 11 percentage-point drop (which is close to what happened!).
It’s worth noting that the unweighted average popularity of these 12 languages is basically the same in 2022 as it was in 2013 (~30%-31%), so the backdrop for interpreting these numbers isn’t one where developers seem to be chomping off more and more of these twelve languages over time — that kind of secular increase (nonexistent, in this case) would make any increase in a given language’s popularity look less surprising, and would make decreases more surprising.
No matter how you slice it (a 26 percentage point increase in popularity, a ~120% increase in popularity), 2013-2022 was a roaring decade for Python.
❤️🐍 People Love Python Now, but No More Than Before
People love Python. (Stack Overflow defines “love” as saying you want to keep using a programming language in the coming year.) 67% of current Python users say they want to keep going. Among “programming, scripting, and markup languages,” this only comes in below five others: 1) Rust (87% — wow!), 2) Elixir (75%), 3) Clojure (75%), 4) Typescript (73%), and 5) Julia (73%). But being in the number six spot means that Python is more loved than 36 listed languages, including: SQL (64%), C# (63%), PHP (42%), R (42%), and VBA (21%).
Quick digression: This lack of love for R makes RStudio’s recent name change to Posit seem wise (RStudio did this to emphasize that it has support for other languages, like Python), especially because fewer than 5% of developers use R. Pandas alone has 5X the developer usage that R has! End of digression.
Okay, but do people love Python more than they used to? The answer: Not really. But they don’t not love Python more than they used to. In the chart below, we see some swings — most notably a bump in love between 2017 and 2019 — but this did not persist, and we’re back at the 2015 numbers. People love Python, and with some ups and downs, that’s been true for a long time.
Pandas Is Now As Popular As Python Was in 2016
Over the years, Stack Overflow has added questions about up-and-coming languages to its survey, and it’s also created new categories so it can better organize the results. In 2019, Stack Overflow officially knighted pandas as an important player by starting to include it on what is now called the “Other Frameworks and Libraries” list. Earning a spot was in and of itself a sign that pandas had made it!
But because Stack Overflow only started asking about pandas in 2019, we have less info here. The major story that emerges is that Pandas’ popularity has doubled in the past four years, with a rise from 12.7% to 25.0%.
This is remarkable: Pandas is now as popular as ALL OF PYTHON WAS IN 2016!
Much of this is due to a large bump between the 2020 and 2021 surveys, though I don’t know the cause. If you do, please message Ponder on Twitter to let us know!
Pandas Has High Adoption in the Python Community
So with pandas’ rise in popularity, what percent of Python users are pandas users? It looks like the answer is somewhere between 52% and 55%.
We get the 52% number by doing a back-of-the envelope calculation: If 48% of all respondents in the Stack Overflow survey said they were Python users, and 25% of all respondents said they were Pandas users, implicitly the share of Python users who are pandas users is somewhere around 52% (25%/48%). This number aligns with the results in the Python Developers Survey, administered by the Python Software Foundation and JetBrains, which states that 55% of Python users are pandas users. (We don’t focus much on the Python Developers Survey in this blog post, in spite of the fact that it’s excellent, because our primary goal here is to contextualize Python’s growth relative to other languages, and that survey is Python-specific.)
The fact that these two surveys paint the same picture is comforting — it supports the idea that the Stock Overflow numbers are reasonably well calibrated. We can confirm this by looking at Numpy’s numbers: The Python Developers Survey says that Numpy is the most popular Python library, with 60% of Python users using it. And if we take the Stack Overflow numbers and divide the 29% of all developer using Numpy by the 48% using Python, we get almost exactly 60%!
People Love Pandas (Mostly) ❤️🐼
So we know pandas has gotten more popular. But do people love pandas?
The answer is: Yes, mostly. 65% of pandas users want to continue using it in the coming year, which is very close to the levels Python had in 2022 (67%). Nine libraries/frameworks rank above it on Stack Overflow’s love list (Hugging Face Transformers are #1 at 72%), and 13 rank below it (Spark is at 60%, and Hadoop is at 42% — poor Hadoop.)
But the trend is an interesting one — The share of pandas respondents who said they love pandas fell from ~75% on 2019 to ~65% in 2022.
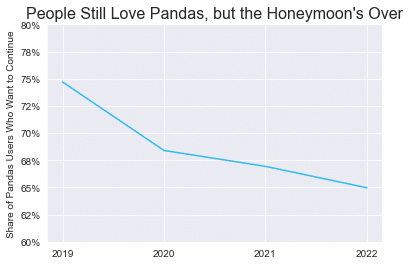
It’s worth noting that 2019 was a bumper year for Python love as well, and if we subset the Python results just over this time frame, we’d get a very similar graph.
Pandas Is More Popular and More Loved Than Spark / Hadoop
Because we’re a company focused on developing Modin, a parallelized enterprise version of pandas that can operate at scale, I’m going to indulge for a moment and note that the developer community has much less knowledge about Spark and Hadoop than it does about pandas: Whereas 25% of developers use pandas extensively, only 5% of developers can say the same for Spark, and a little over 3% for Hadoop. (And the Hadoop numbers appear to be dropping.)
Also, when you look at the average salaries for developers with experience in one of the “Other Frameworks and Libraries” section, you’ll see that Apache Spark developers are the highest paid (at $88K), and Hadoop developers are the third (at $76K), whereas pandas developers are lower down on the list (at $67K).
Given these three facts:
- a much larger pandas developer community (more than 5X the size of these others),
- lower popularity for Spark and Hadoop and higher popularity for pandas, and
- higher required pay for Spark + Hadoop developers
It seems to make sense that if you could find a way to sidestep specialized scaling tools by making your pandas code scale, that might be worth considering!
Conclusion
In this post, we dug into a decade of Stack Overflow Developer Survey results, and extracted the following insights:
- Python’s popularity more than doubled between 2013 and 2022
- People love Python now, but no more than before
- Pandas is now as popular as Python was in 2016
- Pandas has high adoption in the Python community
- People love pandas (mostly)
- Pandas is more popular and more loved than Spark / Hadoop
Of all of these insights, the one that’s most blowing my mind is that pandas usage has grown so much in the past few years that the share of developers using it now matches the share of developers using all of Python in 2016. It is very hard for me to get my brain to successfully run through the thought experiment of going back to 2016 and remembering all of the excitement around Python at the time, and then trying to transfer that level of excitement to the present day, but just for pandas.
We’re excited about the Python / pandas movement. Can’t wait for Stack Overflow’s Developer Survey, 2023 edition!
Have qualms with anything in this article? Want to assert your hearty agreement, or add some color to the discussion? Please comment on our Twitter thread here!
——————————————-
Footnote: I couldn’t see the exact wording for the 2013 question on popularity, but I made the (I think safe) assumption that it is the same as the more recent surveys. (Stack Overflow presents these results as if they were coming from consistent questions over time.)