
Introduction
As I floated in the slow, crystalline current of the Rhine in Basel in the middle of the 2023 Python Dataframe Summit, I found myself asking: “Why are there so many Python dataframe APIs?” (pandas/Modin, Polars, RAPIDS cuDF, Ibis, Snowpark Dataframes, Vaex, Dask, PySpark, Daft, BigQuery Dataframes, etc.)
I have come to three conclusions:
- Dataframe users and maintainers think of dataframes in at least four ways — as spreadsheets, as queries on relational databases, as 2D arrays/matrices, and as objects.
- Each dataframe role model differs — particularly in whether rows are ordered, whether rows have labels, whether eager or lazy execution is the default, and whether there is a separate engine for compute (like a database) — and this motivates developers who see certain characteristics as paramount to create new APIs.
- Underlying the choices about the API is the question of how much performance matters relative to usability, because adding constraints that potentially enhance usability (like row order) comes with a cost.
In this article, I start by briefly describing the characteristics of each of the four dataframe role models. Then I discuss the benefits and drawbacks inherent in ordering rows, labeling rows, defaulting to eager or lazy execution, and using (or not using) a database for compute. I conclude by considering the question: “What do we do?”.1
How the Four Dataframe Role Models Differ
Dataframes take inspiration from at least four modalities of data. These four have some similarities, but in some ways are inconsistent. (You can’t by default have row labels and not have row labels.)
Here’s my summary of their key characteristics:
1. Spreadsheet (like Excel, Google Sheets)
- Usable by non-programmers
- In-place updates
- Implicitly eager
- Maintains ordering (and ordering even stays consistent after saving and quitting the application, unlike order for pandas read_sql calls in two different sessions)
- Can pivot and melt data to reshape it
- Data typically fits on one machine
- Useful for business intelligence (BI) and plotting
2. A Query on a Relational Database
- Tendency is to build up immutable query trees
- No notion of order
- The data that you start with is typically too big to materialize it all on your local machine, but you can materialize a subset
- Traditionally queried with SQL
3. 2D Arrays/Matrices
- A block of values
- Useful for stats and machine learning training/inference
- Mutable
- Rows are ordered
- No column or row labels
- Do a lot of transposing and adding / multiplying objects with each other
- Used with stats and machine learning libraries like scikit-learn, pytorch
4. Objects (in the sense of object-oriented programming)
- How Python users normally sees dataframes — as objects that have a huge variety of methods for viewing and transforming them
- Also how people typically write maintainable data transformation pipelines
This list of characteristics touches on many dimensions, but four that strike me as particularly important — and seem to be critical design points that differentiate dataframe APIs from each other and explain what might motivate someone to launch a new dataframe project — are whether to maintain row order, whether to have row labels, whether to default to eager or lazy execution, and whether to run on a separate execution engine (such as a database).
I will tackle each of these in turn, recognizing that the list of dimensions we’re considering isn’t comprehensive — There are others that matter too (such as whether a dataframe enforces strong typing / fixed schema, etc.).
Question 1: Should Dataframes Have Row Labels?
Every dataframe library that I know of requires that columns have labels. You can select, transform, or manipulate a particular column by referring to its label. You can also use column labels to align data from different frames column-wise. For example, in pandas, if you have two dataframes with the same columns labels in different orders, you can add the columns of the same name together simply by applying the + operator as follows:
import pandas as pd

df1 = pd.DataFrame({'A': [0, 1], 'B': [2, 3]})
df2 = pd.DataFrame({'B': [4, 5], 'A': [6, 7]})
df1 + df2
Some dataframe libraries additionally have row labels. Like column labels for columns, row labels let you refer to parts of a dataframe that come from a particular row or a particular set of rows. You can also use row labels to align data from different frames row-wise.
Use Cases for Row Labels
pandas dataframes have row labels that are just as functional as column labels2, so I’ll use pandas examples to illustrate some use cases of row labels:
Use Case 1: Representing real-world data that has a unique label for each row
Imagine that our starting data represents some information about several people:
Name, Favorite Fruit, Field of Study
John, Apple, Paleoradiology
Mahesh, Pear, Glaciology
The series of names by itself doesn’t mean much, but we could consider each individual name to be a key for a set of associated properties.
This gets more interesting when you have wide-column schemas (as in Cassandra) where different rows might have different sets of properties:
"""
John -> {Fruit: Apple, Field: Thai, City: Seattle}
Mahesh -> {Fruit: Pear, City: LA}
"""
In this case, column-wide aggregation like calculating the sum or mode doesn’t make sense, but we can imagine accessing arbitrary rows by their keys.
Use Case 2: Transposing dataframes gives predictable labels for free
Because row and column labels have equal footing in pandas, there’s a straightforward way to assign row and column labels to a transposed dataframe: each row with labelabecomes a column with labela, and each column with labelbbecomes a row with labelb. For example, here’s pandas transposing a 1x2 frame:
>>> import pandas as pd
>>> df = pd.DataFrame({'likes': [1], 'comments': [2]})
>>> df
   likes  comments
0      1         2
>>> df.transpose()
          0
likes     1
comments  2
Compare this to Polars for the same data:
>>> import polars as pl
>>> df = pl.DataFrame({'likes': [1], 'comments': [2]})
>>> df
shape: (1, 2)
┌────┬──────┐
│ likes ┆ comments │
│ ---   ┆ ---      │
│ i64   ┆ i64      │
╞════════╪══════════╡
│ 1     ┆ 2        │
└────┴──────┘
>>> df.transpose()
shape: (2, 1)
┌──────┐
│ column_0 │
│ ---      │
│ i64      │
╞═══════════╡
│ 1        │
│ 2        │
└──────┘
pandas transposes the columns along with their names. Polars loses the column names because the new rows cannot have any labels!
Use Case 3: Datetime indexes: loc, resample, window
When looking at time series, it’s very common for each row to represent an observation of a set of properties at a particular time. For example, here’s a pandas dataframe of likes per month:
>>> import pandas as pd
>>> df = pd.DataFrame({'likes': list(range(9))}, index=pd.date_range('11/1/2000', periods=9, freq='M'))
>>> df
            likes
2000-11-30      0
2000-12-31      1
2001-01-31      2
2001-02-28      3
2001-03-31      4
2001-04-30      5
2001-05-31      6
2001-06-30      7
2001-07-31      8
I can then filter to just the observations from the year 2001:
>>> df.loc['2001']
            likes
2001-01-31      2
2001-02-28      3
2001-03-31      4
2001-04-30      5
2001-05-31      6
2001-06-30      7
2001-07-31      8
Or get the number of likes per 2-month window:
>>> df.resample('2m').sum()
            likes
2000-11-30      0
2001-01-31      3
2001-03-31      7
2001-05-31     11
2001-07-31     15
Or quickly plot a time series:
>>> import matplotlib.pyplot as plt
>>> df.plot()
>>> plt.show()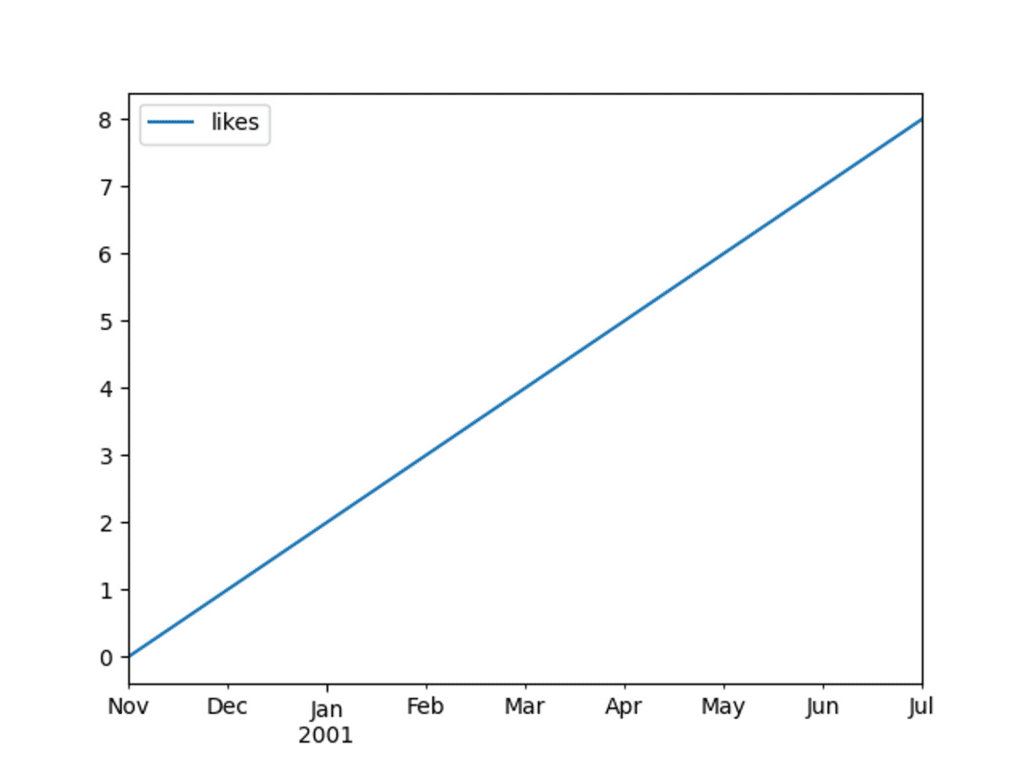
Use Case 4: Nice output for groupby aggregations
pandas users commonly end up with a non-trivial index3 when they group by multiple columns. For example:
>>> import pandas as pd
>>> df = pd.DataFrame({'app': ['Twitter', 'LinkedIn', 'Twitter', 'Twitter'], 'user': ['Rehan', 'Aditya', 'Aditya', 'Rehan']})
>>> df.groupby(['app', 'user']).size()
app       user
LinkedIn  Aditya    1
Twitter   Aditya    1
          Rehan     2
dtype: int64
To me, this output looks beautiful: Now that we have grouped the data by the “app” and “user” columns, we can label each group by the combination of app and user.
Use Case 5: Aligning data row-wise
In this example, we have two integer time series and we want to add them. In one time series, we have 3 dates from 2020-12-21 through 2020-12-23 in ascending order, and in the other, we have 2 dates from 2020-12-21 through 2020-12-22 in descending order. Because the dates are the index of each series, series addition will automatically align the data and assign a value of NaN for dates that aren’t present in either series.
>>> import pandas as pd
>>> import datetime
>>> s1 = pd.Series([20, 30], index=[datetime.datetime(2020, 12, 22), datetime.datetime(2020, 12, 21)])
>>> s1
2020-12-22    20
2020-12-21    30
dtype: int64
>>> s2 = pd.Series([20, 30, 50], index=[datetime.datetime(2020, 12, 21), datetime.datetime(2020, 12, 22),  datetime.datetime(2020, 12, 23)])
>>> s2
2020-12-21    20
2020-12-22    30
2020-12-23    50
dtype: int64
>>> s1 + s2
2020-12-21    50.0
2020-12-22    50.0
2020-12-23     NaN
Freq: D, dtype: float64
In fairness to libraries without row labels, it’s possible to do all these things by making the index as a regular column, but personally I very much like the representation of the data here, as well as the ergonomics for resampling, filtering, implicitly joining on the index, and plotting.
Use Case 6: Speeding up certain operations (especially lookups)
One reason that pandas has row labels is to speed up some operations, especially lookups. This is not dissimilar to indexes in a database, which impose upfront costs to create, but which speed up certain queries. For more, see this Stack Overflow post about how much faster it is to do a lookup when there’s a unique index, and this post about the costs of indexing.
Downsides of Row Labels
Downside 1: Row labels can confuse users
Row indexes are subtle in pandas. The ability to select data by either position or label, or by both at the same time, can make row labels confusing for users. pandas further adds to the confusion by allowing row labels to have a multiindex, which again I think is useful but takes some practice to understand. Operations like groupby and concat can change the index in surprising ways.
Polars eschews row labels completely, and the Polars docs currently say, “Polars aims to have predictable results and readable queries, as such we think an index does not help us reach that objective. We believe the semantics of a query should not change by the state of an index or a reset_index call.”
Downside 2: Row labels can complicate dataframe library development
Speaking from personal experience, maintaining the index in a dataframe implementation can be difficult. In contexts like Ponder’s, where we want to avoid materializing all the data in the index, we have to treat the index as a data column which should or should not be represented as part of the dataframe, depending on the combination of parameters and methods likeas_index,reset_index, andset_indexthat the user has used.
This comes with an opportunity cost: Time taken to implement complex features is time not spent improving other aspects of the library.
Treating the index column as a regular column causes even more pain when it has the same name as a “real” column (and this happens surprisingly often — I have struggled with cases of this forvalue_countsanddf.query).
For an example of this conflict, here’s a dataframe where the index and a column both have the same name.4
>>> pd.DataFrame({'a': ['value']}, index=pd.Index(['i1'], name='a'))
        a
a
i1  value
If we try to represent this in the database with the index as another column, we’re in an uncomfortable situation where when we select column a in SQL, the database won’t know which one we’re referring to. And most databases won't allow you to have two columns with the same name to begin with, so having this state at all (if it is desired by the user) might be impossible.
Maintaining a valid index in a performant way when data is partitioned row-wise has also consumed a lot of time in the implementation of Modin on backends like Ray and Dask.
Question 2: Should Dataframes Be Ordered?
According to the formal definition that was developed by Devin Petersohn and several other folks on our team, the rows in a dataframe have a particular order. Colloquially, I think that most people would agree that dataframes have row order. Common dataframe implementations like Excel, pandas dataframes, and R dataframes, are ordered. However, there are now a few libraries that present a dataframe-like interface but use relational databases for compute and storage. Relational databases do not have a strong notion of order5, so each of these libraries takes a different approach:
- Ibis follows the SQL approach of letting you sort at the end of a query
- The pandas API on Spark doesn’t maintain order by default, but there is an ordered_head option that will at least maintain order for the head() of a dataframe6
- Ponder matches the order semantics of pandas
My impression is that it’s usually not very important to maintain row order within a dataframe query because many common use cases for dataframes don’t depend all that much on order. At least for dataframe APIs like Ponder that push computation down to a database, maintaining order requires some extra implementation complexity and can also be bad for performance.
People do sometimes do row-positional point updates to a dataframe to fix problems with it, e.g.df.iloc[5, 10] = None, but I think that most such cases can use a more expressive filter that doesn’t depend on row order but expresses why we are doing the replacement, such asdf["rating"][df["likes"] > 5] = 5. Still, in applications like spreadsheets where users may not want (or know how) to write code, pointing to a cell by location is the easiest way to update it.
There are some cases in interactive datasets where it would be awkward if the order of the rows kept changing across operations. This is especially true for time series, which can look very strange when the dates are out of order (and I don’t want to have to sort my data in every cell of my Jupyter Notebook— although in practice most unordered dataframe libraries won’t jumble data around all that much even though they can).
Some common linear algebra operations benefit from treating dataframes as ordered rows with no additional row labels (that is, as if they are 2-dimensional numpy arrays with labels only for columns). In this scenario, the position of a row serves as an implicit row label. If we add two unordered dataframes row-wise, we have to join the dataframes on some of their columns to align their rows. This join can be expensive.
On the other hand, if both input tables have ordered rows and actually store adjacent rows close together (as in NumPy / pandas (admittedly in pandas you also have to do a join in the general case, but often you can can quickly check that the indexes are equal, which is especially easy with the default pandas index of RangeIndex(len(df)), then align based on positions instead of labels), aligning the two tables is trivial. Maybe this kind of matrix operation should never be done in a relational database, but some kind of linear algebra (for machine learning training or inference) will very often follow the use pandas or other dataframe libraries in a data pipeline.
Question 3: Should Dataframes Be Lazy?
The Polars docs define eager evaluation as “when code is evaluated as soon as you run the code. Lazy evaluation is when running a line of code means that the underlying logic is added to a query plan rather than being evaluated.”
In many contexts, lazy evaluation is critical for good performance. To take a very simple example, imagine that you have a parquet file of 10 billion rows, and you want to take a look at a few rows to see what the data looks like. The simplest pandas code to do that would be:
import pandas as pd

df = pd.read_parquet("big_file.parquet")
print(df.head())
pandas would read the entire file into memory, then select the first few rows and print them. All the time and memory that went into reading the rest of the rows in would be wasted.
If we were to write equivalent code with a lazy library, we could use predicate pushdown to only read the rows we want when it’s time to print them.
Lazy evaluation does come with some disadvantages and complications:
- Some errors that would appear earlier in an eager workflow will only occur whenever the execution happens. This can surprise users. Even for experienced users, finding and fixing a user or data error that occurred when evaluating a complex query tree (say, somewhere deep within a query, you divide by a column with value 0) can be difficult.
- Some operations can change the column labels in a way that depends on the data, so you have to either ignore user errors that happen after such operations, or do some execution to figure out the result schema. For example, in pandas:
Note the Polars documentation about not including pivot in the lazy Polars API:
Polars could have abstracted this fact for you just like Spark does, but we don’t want you to shoot yourself in the foot with a shotgun. The cost should be clear upfront.
Should Lazy Dataframes Feel Like pandas?
In pandas, the string representation of a dataframe — the one you get via __repr__ 7 by evaluating the dataframe in REPLs like ipython and Jupyter Notebook — will show you the first few and last few rows of the dataframe to give you a sense of what the data looks like. While viewing dataframes this way is probably not a good idea if you’re constrained by memory8, as far as I can tell, it’s extremely common in pandas, and I personally find it very useful.
In some lazy dataframe libraries, like Dask and Polars, to view a dataframe, you have to explicitly trigger computation on an immutable query object with a method likecompute()orcollect(). Others that try to mimic pandas more closely, like Ponder and the pandas API on Spark, will execute a query automatically whenever you need to print a dataframe. Ibis by default requires a call likehead()to trigger execution, but if you turn on interactive mode, printing a table will materialize a few rows from it. In all these libraries, exporting data to some representation other than the library’s dataframe representation, e.g. writing to a database, a parquet file, or a CSV, will also trigger execution.
There’s more to what I call “explicit laziness” than just whether calling __repr__ on a dataframe materializes some of its rows. Some lazy dataframe libraries, like Ponder and the pandas API on Spark, try to let users write code that looks just like regular, eager pandas code, but internally, they defer execution until the user needs to materialize data for printing or for export. Other libraries, like Polars and Ibis, have an interface that makes it clearer that execution is deferred. For example, these libraries might:
- include expression APIs for creating expression objects that represent parts of a query, but that are explicitly not meant to be evaluated immediately.
- limit support for mutating a dataframe, or steer users away from doing that.9
To illustrate what I mean, here’s an example from Polars documentation showing how we’d typically add two new columns to a dataframe in pandas10:
df["tenXValue"] = df["value"] * 10
df["hundredXValue"] = df["value"] * 100
To do the same in Polars11 with either LazyFrame or DataFrame, you do:
df.with_columns(
    (pl.col("value") * 10).alias("tenXValue"),
    (pl.col("value") * 100).alias("hundredXValue"),
)
The Polars code makes it clear that we are creating a new object with particular new columns — we are not modifying the query that the original dataframe represents. Furthermore, we are assigning expressions to the new columns rather than columns. Assigning expressions makes method chaining more natural than it would be in pandas, because we can express our transformation in terms of the columns of the most recent dataframe.
Note than in pandas, we can assign new columns with theassignmethod (note thatassigncreates a new dataframe with the provided columns, rather than updating the original dataframedf):
df.assign(tenXValue = df["value"] * 10,
          hundredXValue = df["value"] * 100)
However, suppose now that we want to chain on top of this assignment another assignment that depends on the new columns. Since the object with the new columns doesn’t exist till after the assign call, we have to do one of the following:
# Option 1: make an intermediate df
intermediate_df = df.assign(tenXValue=df["value"] * 10,
                            hundredXValue=df["value"] * 100)
intermediate_df.assign(tenXValuePlusOne=intermediate_df["tenXValue"] + 1)

# Option 2: use a callable assigner. The df that the callable receives at
# evaluation time will have the new columns in it.
df.assign(tenXValue=df["value"] * 10,
          hundredXValue=df["value"] * 100).assign(
    tenXValuePlusOne=(lambda df: df["tenXValue"] + 1))
Compare to Polars:
df.with_columns(
    (pl.col("value") * 10).alias("tenXValue"),
    (pl.col("value") * 100).alias("hundredXValue"),
).with_columns((pl.col("tenXValue") + 1).alias("tenXValuePlusOne"))
The Polars code can use expressions to chain two with_columns calls without creating an intermediate dataframe or creating a callable.
It’s possible to give the illusion of mutating a dataframe while actually making a new object under the hood. That’s what the pandas API on Spark and Ponder do to support the same column assignment syntax that works on pandas.
Measuring performance for “implicit laziness” is not straightforward. Most users are not used to using lazy data APIs, let alone to understanding how code that uses such APIs is performing. In the first example in this section, a lazy API might execute theread_parquetcall very quickly because it’s just adding theread_parquetto the query, but subsequent operations could take longer if they need to use a lot of the data (for example, printing all the rows withdf.head(len(df))would take a long and the user might ask why).
The clearer an API makes it that the user is creating a query plan and not executing queries every time they call a method, the less likely the user is to be surprised when a step that triggers execution turns out to be slow.
Speaking from personal experience, another good reason for using expressions to specify transformations like this is that the dataframe library itself doesn’t have to go through the trouble of making eager-looking pandas code actually execute lazily. In the original pandas code, Python will first evaluatedf["value"] * 10and then assign the resulting series to a new column. The dataframe’s__setitem__method thus receives a series, not an expression. The meaning of that series is straightforward in pandas, wheredf["value"] * 10actually executes the multiplication by 10, and the new values are copied (perhaps by reference) from the series into the new column ofdf. In libraries like Ponder, though, the result ofdf["value"] * 10is just a series representing a query, whereas__setitem__needs to know the expression that the series represents so that it graft this expression onto the query fordf. Alternatively, if the user provides an expression instead of a dataframe as the RHS of the__setitem__, the library doesn’t have to do as much inference.
I’m not settled on whether it’s best to be explicit about building a query tree, but I lean towards saying that explicit is better than implicit. Perhaps dataframe users are not yet used to the ideas of immutable dataframes or building up query trees lazily. However, it’s very natural to write Python in a functional style, with immutable data structures: list comprehensions, the fact that functions are first class citizens, the prevalance of lambda functions (think of how commonly pandas users try to apply lambdas!), and constructs like map, filter, and reduce make functional programming very natural in Python.
Furthermore, something like 7 million people are comfortable writing SQL queries, which are (often) bulky, stateless, declarative expressions (ok, sometimes, you create a temp table or materialized view, but those can fit into a more explicitly lazy API too). Why shouldn’t it become natural for Python users to think about tabular data in the same way?12
Question 4: Should Dataframes Rely On Databases for Execution?
Nearly everything that calls itself a database can be queried with some form of SQL. SQL is also popular for interactive analysis, especially for querying data that should be in a database. It’s possible to use SQL for complex transformations, but writing and maintaining complex transformations in SQL is typically not easy.13
On the other hand, programming languages like Python are not bound by SQL’s declarative paradigm. They run in an environment where they can refer to local variables and function definitions, and use a variety of packages that are not tied to particular database. Often, manipulating data is just part of a more complex application that has to be written in a language other than SQL. Python, and in particular pandas, is extremely popular for data science (and in the world at large), but it’s often not feasible (for reasons of performance and data governance) to pull all your data onto one machine and run pandas on it.
The holy grail that Ponder is pursuing is that the same pandas API that is useful for interactive data wrangling on your laptop is just as useful for batch processing of data at scale in a large codebase that will be maintained for years by many people. I think that DuckDB’s immense popularity has come from the fact that it is “performant SQL running on your laptop using data from anywhere”, whether your data comes from a parquet file in Amazon S3 or a local CSV file. Likewise, pandas is for “performant Python dataframes running on your laptop using data from anywhere.” Ponder wants to give “performant Python dataframes running where they need to run using data from anywhere.”
My colleague Hazem goes so far as to say that “SQL is more and more turning into this low-level non-user-friendly language for interacting with data (assembly [like x86] for data), while richly-featured dataframe APIs will keep getting more traction as the simpler higher-level language to learn and use for all developer data needs.”
One caveat about these dataframe APIs is that while I think that pushing computation to the database will work well for many kinds of data transformation, exploratory data analysis, and data cleaning, it’s very common for the next step in a data workflow to be machine learning training or inference, and to my knowledge, the existing “pandas on database” libraries have limited functionality for writing machine learning code in python and executing it in the database. I also mentioned earlier that relational databases may not be a great environment for linear algebra. Furthermore, relational databases are not very good for storing tensors or unstructured data, both of which are very common in deep learning.
All this being said, I think that database developers and companies are very interested in making databases work for machine learning. Moreover, the continued development of features like Snowpark ML, postgres ml, BigQuery ML, and pgvector suggests to me that these kinds of features, too, will fit into the APIs of popular existing libraries for machine learning and statistics.
What Do We Do About the Presence of So Many Dataframe APIs?
There are many Python dataframe libraries that are meant to be convenient and performant. All of them are supposed to work for interactive as well as offline/batch use-cases. Unfortunately each library has its own API, so every time you switch libraries, you have to learn a new API, and more importantly, when an organization has a lot of code that uses one library, it has to migrate all of that code to the new library. Also, third-party libraries that use dataframes for plotting or stats have to handle all the dataframe implementations (the dataframe interchange protocol and the dataframe standard are already helping with this problem, though).
BigQuery, Spark, and Ponder each have their own pandas-based Python dataframe library that uses the corresponding database for storage and compute. However, each library follows pandas to a different degree, and as far as I know, none of these claims to exactly match the API of a particular pandas version.
Every time I see a new dataframe library that has nearly the same functionality as others but a slightly different API, I wonder if there’s a better way. This is one reason that I like our vision at Ponder: The pandas API is undesirable in some respects, but there is already a lot of pandas code out there, and many people already know how to write pandas.14
Conclusion
At the beginning of this article, I mentioned that dataframes act as spreadsheets, queries on relational databases, two-dimensional arrays, and as objects in the runtime of a programming language. Some of the expectations of each modality are in conflict with each other. I think part of the popularity but also the complexity of pandas is that it has expanded to fill all these roles. In the near future, I think the many Python dataframe library libraries will coexist, and each will fulfill each kind of functionality to a different extent. I think that Ponder’s direction of “the pandas API runs where you need it to” is exciting, and I invite you to try out Ponder.
Try Ponder Today
Start running your Python data science workflows in your database within minutes!
Acknowledgements
Thanks to Peter Olson, Gopal Vashishtha, and John Kew for feedback and help writing this post.
Footnotes
1. While not all the libraries I discuss provide dataframe APIs strictly speaking, I’ll refer to all the libraries as “dataframe libraries.”
Some of the libraries here have, in addition to dataframe objects, series objects that represent a single column of a dataframe. Most of the discussion here applies to both series and dataframes, so I’ll only refer to dataframes.
Note that I’m writing specifically about APIs and not focusing much on how each API is implemented. The APIs I mention here span many modes of computation and storage, each of which has certain merits.
2. One way in which rows are not on an equal footing with columns in pandas: While many methods can operate either row-wise or column-wise, some methods like get_dummies have arguments that operate only on columns.
3. The default index in pandas is a RangeIndex(n) , where n is the number of rows. Each row has a numeric label corresponding to its zero-indexed position in the dataframe. I consider this kind of index to be “trivial.”
4. Prior to pandas 2.0, value_counts() actually produced series with the same name as their index, and to_series(), which is internally used in query and eval, still does the same.
5. In SQL, you can ORDER the results of a query, but this ordering is only meaningful for presentation to the user, and a query on a subquery that includes an ORDER BY will not necessarily preserve the order from the subquery.
Some databases have something like a ROW_NUMBER() function that will assign a sequence of numbers to the rows in a relation, but this function is not guaranteed to be deterministic and databases will not propagate a correct set of row numbers through operations like filters (which drop some numbers) and sorts (which will reorder data).
6. I haven’t taken the time to figure out how ordering works in the pandas API on Spark. I don’t know exactly what iloc means if “pandas-on-Spark does not guarantee the row ordering.” I don’t know whether ordered_head only affects head or it affects ordering for other methods as well. Corrections are welcome!
7. Actually both __repr__ and _repr_html: https://github.com/ipython/ipython/issues/9771
(I discovered this while debugging a slow repr for a modin.pandas dataframe)
8. … because Jupyter and ipython will save your REPL outputs in variables. Learn from my mistakes: https://dask.discourse.group/t/why-is-distributed-leaking-memory-from-unused-futures/959
9. Matt Harrison gives an explanation here for why, at least in pandas, creating columns by updating an existing dataframe is not suitable for method chaining, which is what we want to do in lazy execution.
10. pandas offers the assign methods to update dataframes without mutating them (see also Matt Harrison’s posts about chaining with assign), but the __setitem__ idiom is still very common.
11. As of Polars 0.18.4, setting a column of a DataFrame this way seems to be impossible, but if you really want to mutate a (non-lazy) DataFrame, you can do assign a numpy array to a dataframe, though that’s not recommended (note that under the hood, this is using with_columns, too):
import polars as pl

df = pl.DataFrame([1])
df[['column_0']] = [[4]]
df
12. If dataframe APIs eschew order and don’t allow mutability, are they just a thin wrapper around SQL? Put another way, “A big question for me [John] is whether dataframe-like APIs will really just converge on being a DSL for SQL, complete with less formal ordering semantics.” — My colleague John Kew. Will dataframe APIs end up like an ORM with syntactic sugar?
13. Yes, you can express a lot of thing in SQL, and it’s even turing complete, but programming languages that are less declarative are more expressive.
“In ETL pipelines these were implemented through files containing thousands of lines of raw SQL which were hard to scale, test, and iterate upon.” This team found success using Spark and Scala instead: https://www.databricks.com/dataaisummit/session/nebula-journey-scaling-instacarts-data-pipelines-apache-sparktm-and-lakehouse/
14. Now that I’m developing the Ponder library, which can translate Python queries to multiple SQL dialects, I’m also becoming more aware of the fact that SQL has an analogous problem: There are many, many relational databases, and each one uses its own, slightly different SQL dialect. I don’t know of a solution to this problem.