
In our previous post, we discussed how pandas is the most popular data analysis library in Python. However, visualizing your data within pandas to get insights is a slow and tedious process, requiring data scientists to write many lines of boilerplate code. In this post, we introduce Lux, a popular open-source library that we’ve developed to make visualizing your pandas dataframes as easy as a single print.
Problem
pandas makes it easy to perform a variety of data-centric tasks, including cleaning, feature engineering, and summarization. But exploring and visualizing data in your pandas dataframe still remains a challenge.
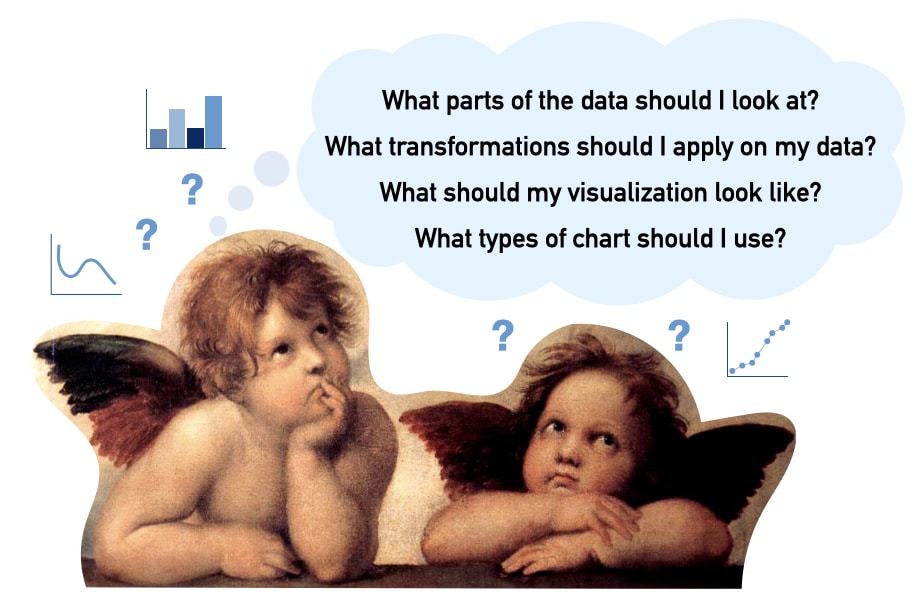
For starters, there are a number of different operations you could perform on your data to get to interesting insights. That includes asking and answering questions like:
- What portions of the data should I filter to and look at?
- What cleaning operations do I need to perform to make sure the data is well-formatted?
- Are there any missing values or outliers in my data?
- What visualizations should I plot to highlight the patterns and trends?
- What type of visualization should I use? What should be the visualization encoding (the axes, color, sizes, …)?
- How do I process the data to get to those visualizations?
The list goes on…
What’s worse is that at every step of your exploration, you would not only need to figure out what are the right operations to apply to your data but also what code you need to write to accomplish these operations. The visualization-centric code often encompasses many lines of boilerplate; studies have shown that visualization code occupies the vast majority of duplication in computational notebooks (as much as 20%). Overall, the code-centric trial-and-error process can be incredibly tedious and time-consuming and often leads to much fewer insights. A 2019 report showed that 44% of data analysis time every week (16 hours!) is wasted because data workers are unsuccessful in their activities, with searching and preparation being the most time-consuming. These barriers to exploration often hinder meaningful exploration, as a result, users often only visualize their data during the final stages of their analyses.
Introducing Lux
To address these pain points, we’ve developed a lightweight visualization tool on top of pandas dataframes called Lux. Lux makes it dead simple for data scientists to explore their data by automatically recommending useful and relevant visualizations as they are working with their pandas dataframe.
To use Lux, you simply need to add import lux along with your pandas import statement.
import lux
import pandas as pd
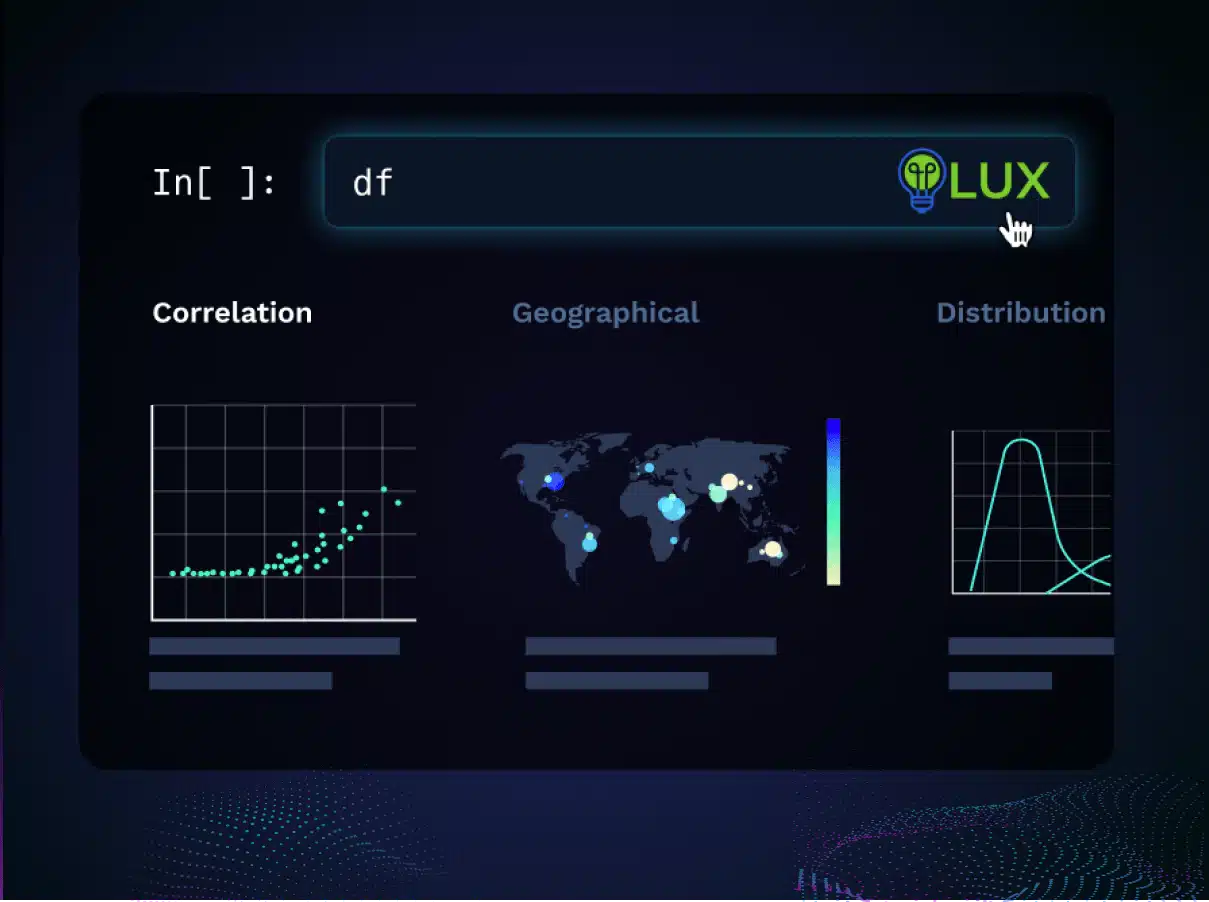
Then whenever you print out a dataframe in your notebook, Lux automatically recommends a dashboard of visualizations for you with zero effort.
As shown in the example above, Lux provides an alternative way that dataframes can be visualized in addition to the default tabular view from pandas. So at any point in your analysis, the recommended visualization is “always-on” in the sense that you can easily toggle back and forth between these complementary views. The recommended visualizations help you get a quick visual overview of the data by showcasing distributions, correlations, and even geographic patterns hidden in your data. With a few keystrokes, you can also tailor the recommendations to highlight aspects of the data that you care most about.
Lux addresses the challenging problem of how to identify and display the most interesting and relevant visualizations to users in an interactive manner. Under the hood, Lux is powered by an intelligent and scalable engine that builds on our research in visualization recommendation techniques over the past decade. Specifically, our engine automatically combs through a large number of potential visualizations to score and recommend the ones that are most likely to be interesting or useful to the user or advance the state of analysis. For more information about how our recommendation engine works, check out this post about our VLDB 2022 research paper.
Adoption of Lux & Community Engagement
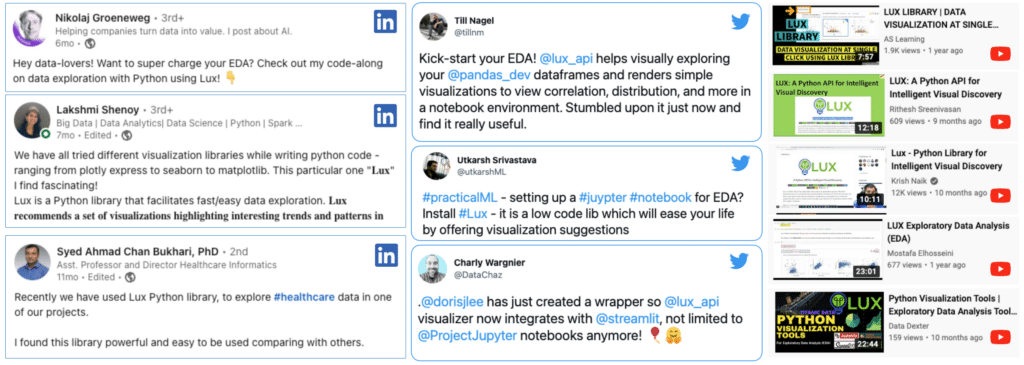
Since our first public release of Lux in October 2020, we have seen considerable growth in open source adoption and usage. To date, Lux has been downloaded more than 100k times and has over 3000 stars on Github. Lux brings together a vibrant community with many who have written blog posts, articles, or tweets, and even created Youtube videos describing the benefits of Lux. We’ve been invited to present Lux at many different venues, including PyData, Stanford MLSys, to name a few.
Most importantly, for many data practitioners, Lux is solving a crucial pain point in the data exploration process. We have seen a variety of use cases spanning industries where Lux is being used to solve real-world data science problems. Here are a few examples:
- Data scientist at a telecommunications company using Lux to visualize and detect anomalies on mobile networks
- Researchers at a pharmaceutical company using Lux to analyze experiment data towards building models for drug discovery
- Data scientist at an insurance company using Lux to search for patterns and key variables for building a predictive model
- Data analyst at an ecommerce company using Lux to generate analytical reports and presentations for visualizing market share data across different geographic regions
- Education researcher at a university using Lux to group variables and explore correlations across 100+ columns of survey data
What’s next
At Ponder, our mission is to empower data scientists to get insights faster with the tools they already use and love. With Lux, you no longer have to worry about when and how you should visualize your data. You can directly operate on your pandas dataframes, and see the visualizations seamlessly displayed to you right away.
We are really excited about the tremendous potential for Lux in helping data scientists discover interesting trends and patterns in their data — with zero effort. You can learn more about Lux by checking out our GitHub repo.
Lux is an integral component of what we’re building at Ponder. If you are excited about what we’re building — and how we’re keeping the needs of data scientists front and center — please check out our job postings. We’re hiring!
If you are interested in learning more about how Ponder helps accelerate your data science workflows, we’d love to hear from you! Schedule a demo to learn more!